
Why Stowliva
Our Collective Impact
How to measure a packaging improvement: begin with material use, account for the packaging job, and separate observations from modeled environmental savings.
Explore the guide ↓
An impact number is meaningful when you can see its baseline, calculation and boundary. Here is a worked example a growing brand can follow.
- Compare the same useful packaging service.
- Keep mass reduction, recovered inputs and carbon estimates separate.
- Show the baseline and arithmetic behind a result.
On this page
Start with one clearly defined packaging jobCalculate material prevented with a simple baselineCalculate recovered inputs separately from reductionCount actual returns and recovery outcomesEnvironmental estimates need a named method and assumptionsPublish the result in a form another person can check01 / 06
Start with one clearly defined packaging job
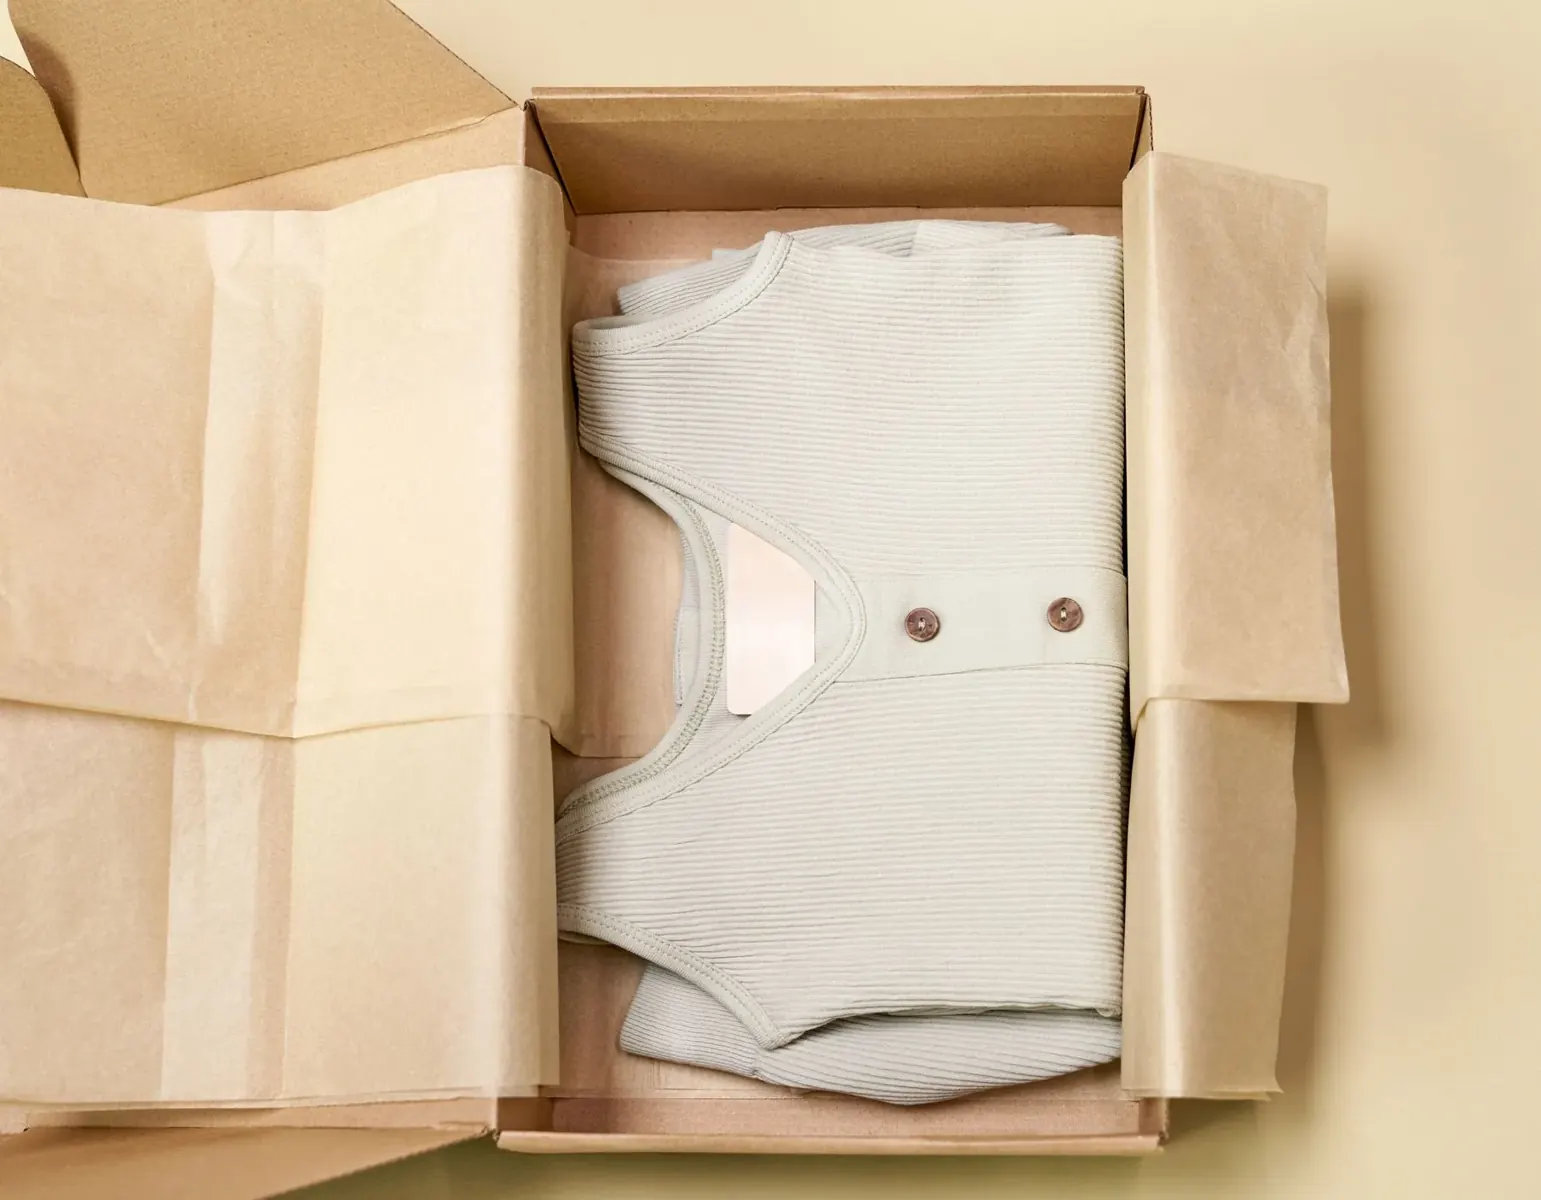
An impact comparison needs a unit of useful service. For example: deliver 20,000 of the same products safely to the same type of destination. This keeps the comparison connected to what packaging is for. Twenty thousand lightweight packs and twenty thousand packs that cause more product damage do not provide an equivalent result.
Record the starting components, weights and quantities. Separate the material used in the product pack from warehouse waste and transport packaging so totals do not quietly change scope. These records can support a material-use calculation before a brand has enough information for a full life-cycle assessment.
02 / 06
Calculate material prevented with a simple baseline
Suppose the current pack weighs 120 g and a successful redesign weighs 105 g for the same protected product. The difference is 15 g per pack. At 20,000 packs, 15 × 20,000 = 300,000 g, or 300 kg less packaging material. The percentage reduction is 15 ÷ 120 = 12.5%.
This result describes prevented material use. It does not, on its own, calculate greenhouse-gas emissions, water use or trees saved. A buyer can report the mass change clearly without adding unsupported conversions. The example assumes the same production quantity and protection; a change in either needs to be included.
| Measure | Before | After | Meaning |
|---|---|---|---|
| Unit pack weight | 120 g | 105 g | 15 g less material per pack |
| Number of equivalent orders | 20,000 | 20,000 | Same service quantity |
| Total packaging mass | 2,400 kg | 2,100 kg | 300 kg less packaging |
| Carbon saving | Not calculated | Not calculated | Requires separate modeling |
Worked example · illustrative values
Before: 120 g × 20,000 = 2,400 kg. After: 105 g × 20,000 = 2,100 kg. Difference: 300 kg, or 12.5% of the baseline packaging mass.
03 / 06
Calculate recovered inputs separately from reduction
A redesigned carton may contain less material and a different recovered share. Those are two separate calculations. Suppose the 105 g carton has 80% verified recovered content, including 60% PCR by carton weight. It contains 84 g recovered material, of which 63 g is post-consumer.
At 20,000 cartons, that is 1,680 kg recovered inputs, including 1,260 kg PCR. These are composition-based quantities, not proof that an equivalent mass was diverted from landfill because of this order. Do not add the PCR mass to the recovered mass as if they were independent benefits: PCR is already a subset of the total.
Avoid double counting
In this illustrative carton, the 63 g PCR is part of the 84 g recovered total. Reporting 147 g of recovered benefit would count the post-consumer portion twice.
04 / 06
Count actual returns and recovery outcomes
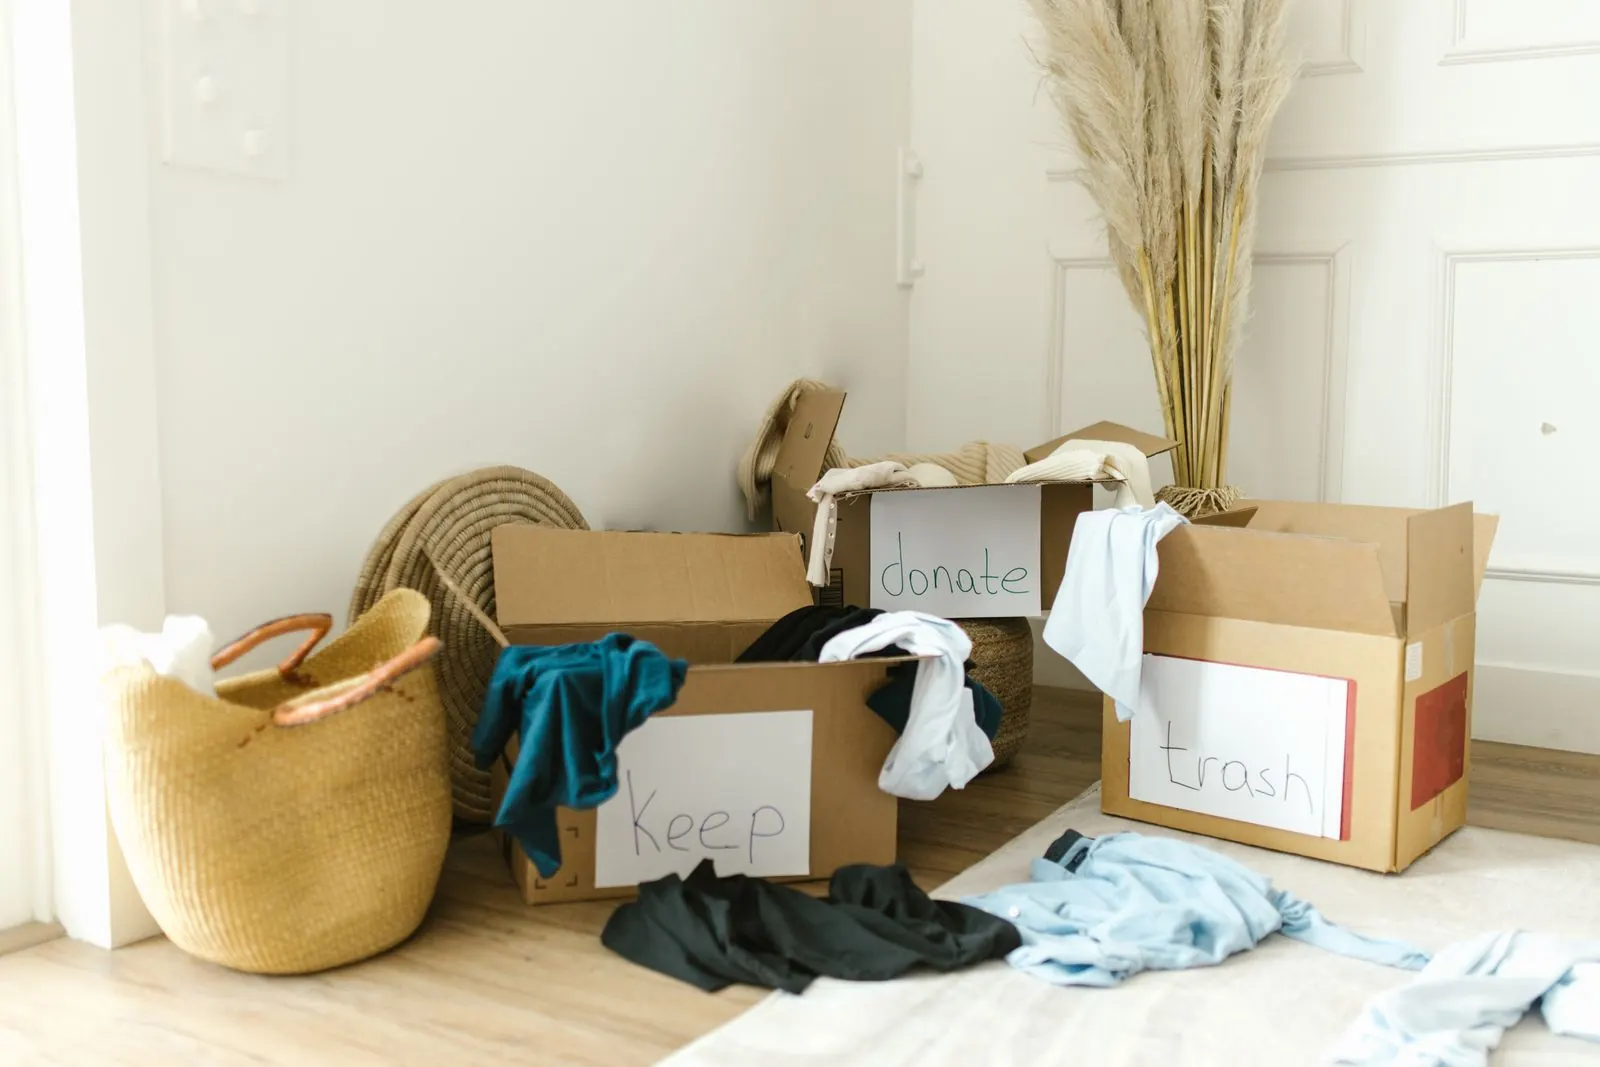
Ordering 10,000 recyclable cartons does not show how many were recycled. Issuing 100 returnable pouches does not show how many return trips they completed. Design capability, customer participation and observed outcome are different measures.
Where a take-back system exists, track items received, reusable items, material accepted by the processor and rejected material. Where consumer disposal is not observed, describe the designed route and its evidence rather than inventing a recovery total. A candid limit is more useful than a large number whose origin cannot be explained.
05 / 06
Environmental estimates need a named method and assumptions
Greenhouse-gas savings require a comparison of emissions across defined stages. Material production, energy, freight, product losses and waste management can all influence the result. A model may use average factors rather than measurements from the particular factory and shipment.
This does not make modeling useless. It makes the assumptions part of the result. State the model version, materials, quantities, geography and scenarios. A recycled-resin result should not be presented as the footprint of the whole printed parcel, and mass prevented should not be relabeled as carbon prevented.
06 / 06
Publish the result in a form another person can check
A concise progress statement might say: ‘For 20,000 equivalent packs, a tested redesign reduced unit packaging mass from 120 g to 105 g, preventing 300 kg of material use compared with the baseline.’ Retain the component records, test results and calculation behind that sentence.
Stowliva does not publish the worked values on this page as company-wide achieved savings. They illustrate a method for your project. Shared progress becomes credible when the quantity, comparison and remaining unknowns are visible to the next reader.
Official and first-party resources · reviewed October 7, 2026
Put the learning into your next pack.
Share your product, material questions and destination with Stowliva.